What's an easy way to plot the C-V curve of a back-biased diode?

Maybe a constant-current ramp, then a differentiator, and a little
math block?

Or, flip that over, constant voltage ramp and current sensor, less
math.

Low level AC voltage on top of a DC sweep, and some sort of AC current
detector? (Fake Boonton)


--

John Larkin         Highland Technology, Inc

jlarkin att highlandtechnology dott com
http://www.highlandtechnology.com
LT Spice diode C-V graph
Started by ●June 27, 2014
Reply by ●June 27, 20142014-06-27
On Fri, 27 Jun 2014 16:20:18 -0700, John Larkin <jlarkin@highlandtechnology.com> wrote:> > >What's an easy way to plot the C-V curve of a back-biased diode? > >Maybe a constant-current ramp, then a differentiator, and a little >math block? > >Or, flip that over, constant voltage ramp and current sensor, less >math. > >Low level AC voltage on top of a DC sweep, and some sort of AC current >detector? (Fake Boonton)This is rude and crude but looks OK. Horizontal is 1 ns per volt, vertical is 1 volt per pF. That 1N914 keeps depleting past 1 kilovolt! Version 4 SHEET 1 896 680 WIRE 48 80 0 80 WIRE 176 80 48 80 WIRE 320 80 240 80 WIRE 416 80 320 80 WIRE 512 80 464 80 WIRE 560 80 512 80 WIRE 0 144 0 80 WIRE 320 144 320 80 WIRE 464 144 464 80 WIRE 416 160 416 80 WIRE 0 272 0 224 WIRE 320 272 320 224 WIRE 416 272 416 208 WIRE 464 272 464 224 FLAG 0 272 0 FLAG 320 272 0 FLAG 416 272 0 FLAG 464 272 0 FLAG 512 80 CAP FLAG 48 80 RAMP SYMBOL diode 240 64 R90 WINDOW 0 -57 29 VBottom 2 WINDOW 3 -52 29 VTop 2 SYMATTR InstName D1 SYMATTR Value 1N914 SYMBOL res 304 128 R0 WINDOW 0 -58 44 Left 2 WINDOW 3 -61 74 Left 2 SYMATTR InstName R1 SYMATTR Value 1m SYMBOL voltage 0 128 R0 WINDOW 0 28 111 Left 2 WINDOW 3 -11 192 Left 2 WINDOW 123 0 0 Left 2 WINDOW 39 0 0 Left 2 SYMATTR InstName V1 SYMATTR Value PULSE(0 2000 0 2000n) SYMBOL e 464 128 R0 WINDOW 0 64 53 Left 2 WINDOW 3 58 85 Left 2 SYMATTR InstName E1 SYMATTR Value 1e6 TEXT 16 104 Left 2 ;RAMP 1 V/nS TEXT 496 112 Left 2 ;1 V / pF TEXT 538 315 Left 2 !.tran 500n TEXT 360 -40 Left 2 ;Capacitor C:V Curve TEXT 352 0 Left 2 ;J Larkin June 27, 2014 -- John Larkin Highland Technology Inc www.highlandtechnology.com jlarkin at highlandtechnology dot com Precision electronic instrumentation
Reply by ●June 28, 20142014-06-28
On 6/27/2014 9:31 PM, John Larkin wrote:> On Fri, 27 Jun 2014 16:20:18 -0700, John Larkin <jlarkin@highlandtechnology.com> > wrote: > >> >> >> What's an easy way to plot the C-V curve of a back-biased diode? >> >> Maybe a constant-current ramp, then a differentiator, and a little >> math block? >> >> Or, flip that over, constant voltage ramp and current sensor, less >> math. >> >> Low level AC voltage on top of a DC sweep, and some sort of AC current >> detector? (Fake Boonton) > > > This is rude and crude but looks OK. Horizontal is 1 ns per volt, vertical is 1 > volt per pF. That 1N914 keeps depleting past 1 kilovolt!Grekhov should have lived to see this day. Spherical cows rule. ;) Cheers Phil Hobbs -- Dr Philip C D Hobbs Principal Consultant ElectroOptical Innovations LLC Optics, Electro-optics, Photonics, Analog Electronics 160 North State Road #203 Briarcliff Manor NY 10510 hobbs at electrooptical dot net http://electrooptical.net
Reply by ●June 29, 20142014-06-29
On Friday, June 27, 2014 4:20:18 PM UTC-7, John Larkin wrote:> What's an easy way to plot the C-V curve of a back-biased diode?Easy, is to buy the source/meter Keithley solution. They'd love to explain it all to you... <http://www.keithley.com/promo/lp/semiconductor>> Low level AC voltage on top of a DC sweep, and some sort of AC current > detector? (Fake Boonton)This one, I think; the small-signal capacitance versus voltage is a very good indicator of the doping profile inside the junction (as the depletion region boundary moves through the various dopant concentrations). Classic work on this was done at Bell Labs, by Lawrence and Warner Diffused Junction Depletion Layer Capacitance Caculations, BSTJ vol. 34, 1955
Reply by ●June 29, 20142014-06-29
On Sun, 29 Jun 2014 01:15:08 -0700 (PDT), whit3rd <whit3rd@gmail.com> wrote:>On Friday, June 27, 2014 4:20:18 PM UTC-7, John Larkin wrote: >> What's an easy way to plot the C-V curve of a back-biased diode? > >Easy, is to buy the source/meter Keithley solution. They'd love >to explain it all to you... ><http://www.keithley.com/promo/lp/semiconductor>I bought an expensive Keithley source-meter. Crap. Sent it back. But I meant in LT Spice, which is why I titled the post "LT Spice..." I can read the C-V curve off the data sheet. What I want to do is make sure (or force) my Spice sim to behave like the actual diode, so I want to do a simulation of the diode c-v curve, to make sure I have everything right. -- John Larkin Highland Technology Inc www.highlandtechnology.com jlarkin at highlandtechnology dot com Precision electronic instrumentation
Reply by ●June 29, 20142014-06-29
On Sun, 29 Jun 2014 07:29:40 -0700, John Larkin <jjlarkin@highNOTlandTHIStechnologyPART.com> wrote:>On Sun, 29 Jun 2014 01:15:08 -0700 (PDT), whit3rd <whit3rd@gmail.com> wrote: > >>On Friday, June 27, 2014 4:20:18 PM UTC-7, John Larkin wrote: >>> What's an easy way to plot the C-V curve of a back-biased diode? >> >>Easy, is to buy the source/meter Keithley solution. They'd love >>to explain it all to you... >><http://www.keithley.com/promo/lp/semiconductor> > >I bought an expensive Keithley source-meter. Crap. Sent it back. > >But I meant in LT Spice, which is why I titled the post "LT Spice..." > >I can read the C-V curve off the data sheet. What I want to do is make sure (or >force) my Spice sim to behave like the actual diode, so I want to do a >simulation of the diode c-v curve, to make sure I have everything right.I mistakenly also thought you were trying to devise an instrument. There's a better way in a Spice simulator, using a gimmick I devised to measure input capacitance in amplifiers... extracts both real and imaginary parts. If I have time today, I'll post it. ...Jim Thompson -- | James E.Thompson | mens | | Analog Innovations | et | | Analog/Mixed-Signal ASIC's and Discrete Systems | manus | | San Tan Valley, AZ 85142 Skype: skypeanalog | | | Voice:(480)460-2350 Fax: Available upon request | Brass Rat | | E-mail Icon at http://www.analog-innovations.com | 1962 | I love to cook with wine. Sometimes I even put it in the food.
Reply by ●June 29, 20142014-06-29
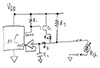
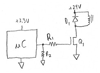
On Sun, 29 Jun 2014 07:29:40 -0700, John Larkin <jjlarkin@highNOTlandTHIStechnologyPART.com> wrote:>On Sun, 29 Jun 2014 01:15:08 -0700 (PDT), whit3rd <whit3rd@gmail.com> wrote: > >>On Friday, June 27, 2014 4:20:18 PM UTC-7, John Larkin wrote: >>> What's an easy way to plot the C-V curve of a back-biased diode? >> >>Easy, is to buy the source/meter Keithley solution. They'd love >>to explain it all to you... >><http://www.keithley.com/promo/lp/semiconductor> > >I bought an expensive Keithley source-meter. Crap. Sent it back. > >But I meant in LT Spice, which is why I titled the post "LT Spice..." > >I can read the C-V curve off the data sheet. What I want to do is make sure (or >force) my Spice sim to behave like the actual diode, so I want to do a >simulation of the diode c-v curve, to make sure I have everything right.I don't know how to post-process data in LTspice, but here's how I do it in PSpice... <http://www.analog-innovations.com/SED/C-V_Plot%20-%20PSpice%20AD.png> An alternative is to do it like the Keithley does, superimpose a small sinusoidal signal on the DC, and measure the co-sinusoidal current. ...Jim Thompson -- | James E.Thompson | mens | | Analog Innovations | et | | Analog/Mixed-Signal ASIC's and Discrete Systems | manus | | San Tan Valley, AZ 85142 Skype: skypeanalog | | | Voice:(480)460-2350 Fax: Available upon request | Brass Rat | | E-mail Icon at http://www.analog-innovations.com | 1962 | I love to cook with wine. Sometimes I even put it in the food.
Reply by ●June 29, 20142014-06-29
On Sun, 29 Jun 2014 09:58:04 -0700, Jim Thompson <To-Email-Use-The-Envelope-Icon@On-My-Web-Site.com> wrote:>On Sun, 29 Jun 2014 07:29:40 -0700, John Larkin ><jjlarkin@highNOTlandTHIStechnologyPART.com> wrote: > >>On Sun, 29 Jun 2014 01:15:08 -0700 (PDT), whit3rd <whit3rd@gmail.com> wrote: >> >>>On Friday, June 27, 2014 4:20:18 PM UTC-7, John Larkin wrote: >>>> What's an easy way to plot the C-V curve of a back-biased diode? >>> >>>Easy, is to buy the source/meter Keithley solution. They'd love >>>to explain it all to you... >>><http://www.keithley.com/promo/lp/semiconductor> >> >>I bought an expensive Keithley source-meter. Crap. Sent it back. >> >>But I meant in LT Spice, which is why I titled the post "LT Spice..." >> >>I can read the C-V curve off the data sheet. What I want to do is make sure (or >>force) my Spice sim to behave like the actual diode, so I want to do a >>simulation of the diode c-v curve, to make sure I have everything right. > >I don't know how to post-process data in LTspice, but here's how I do >it in PSpice... > ><http://www.analog-innovations.com/SED/C-V_Plot%20-%20PSpice%20AD.png> > >An alternative is to do it like the Keithley does, superimpose a small >sinusoidal signal on the DC, and measure the co-sinusoidal current. > > ...Jim ThompsonThe voltage ramp thing that I did seems OK. It does report the initial capacitance of a 1N914 as 4 pF, which is high, but that's the value in the LT Spice model. -- John Larkin Highland Technology Inc www.highlandtechnology.com jlarkin at highlandtechnology dot com Precision electronic instrumentation
Reply by ●June 29, 20142014-06-29
On Sun, 29 Jun 2014 11:24:05 -0700, John Larkin <jjlarkin@highNOTlandTHIStechnologyPART.com> wrote:>On Sun, 29 Jun 2014 09:58:04 -0700, Jim Thompson ><To-Email-Use-The-Envelope-Icon@On-My-Web-Site.com> wrote: > >>On Sun, 29 Jun 2014 07:29:40 -0700, John Larkin >><jjlarkin@highNOTlandTHIStechnologyPART.com> wrote: >> >>>On Sun, 29 Jun 2014 01:15:08 -0700 (PDT), whit3rd <whit3rd@gmail.com> wrote: >>> >>>>On Friday, June 27, 2014 4:20:18 PM UTC-7, John Larkin wrote: >>>>> What's an easy way to plot the C-V curve of a back-biased diode? >>>> >>>>Easy, is to buy the source/meter Keithley solution. They'd love >>>>to explain it all to you... >>>><http://www.keithley.com/promo/lp/semiconductor> >>> >>>I bought an expensive Keithley source-meter. Crap. Sent it back. >>> >>>But I meant in LT Spice, which is why I titled the post "LT Spice..." >>> >>>I can read the C-V curve off the data sheet. What I want to do is make sure (or >>>force) my Spice sim to behave like the actual diode, so I want to do a >>>simulation of the diode c-v curve, to make sure I have everything right. >> >>I don't know how to post-process data in LTspice, but here's how I do >>it in PSpice... >> >><http://www.analog-innovations.com/SED/C-V_Plot%20-%20PSpice%20AD.png> >> >>An alternative is to do it like the Keithley does, superimpose a small >>sinusoidal signal on the DC, and measure the co-sinusoidal current. >> >> ...Jim Thompson > >The voltage ramp thing that I did seems OK. > >It does report the initial capacitance of a 1N914 as 4 pF, which is high, but >that's the value in the LT Spice model.The PSpice model has the same CJ0. ...Jim Thompson -- | James E.Thompson | mens | | Analog Innovations | et | | Analog/Mixed-Signal ASIC's and Discrete Systems | manus | | San Tan Valley, AZ 85142 Skype: skypeanalog | | | Voice:(480)460-2350 Fax: Available upon request | Brass Rat | | E-mail Icon at http://www.analog-innovations.com | 1962 | I love to cook with wine. Sometimes I even put it in the food.
Reply by ●June 29, 20142014-06-29
On Sun, 29 Jun 2014 11:48:52 -0700, Jim Thompson <To-Email-Use-The-Envelope-Icon@On-My-Web-Site.com> wrote:>On Sun, 29 Jun 2014 11:24:05 -0700, John Larkin ><jjlarkin@highNOTlandTHIStechnologyPART.com> wrote: > >>On Sun, 29 Jun 2014 09:58:04 -0700, Jim Thompson >><To-Email-Use-The-Envelope-Icon@On-My-Web-Site.com> wrote: >> >>>On Sun, 29 Jun 2014 07:29:40 -0700, John Larkin >>><jjlarkin@highNOTlandTHIStechnologyPART.com> wrote: >>> >>>>On Sun, 29 Jun 2014 01:15:08 -0700 (PDT), whit3rd <whit3rd@gmail.com> wrote: >>>> >>>>>On Friday, June 27, 2014 4:20:18 PM UTC-7, John Larkin wrote: >>>>>> What's an easy way to plot the C-V curve of a back-biased diode? >>>>> >>>>>Easy, is to buy the source/meter Keithley solution. They'd love >>>>>to explain it all to you... >>>>><http://www.keithley.com/promo/lp/semiconductor> >>>> >>>>I bought an expensive Keithley source-meter. Crap. Sent it back. >>>> >>>>But I meant in LT Spice, which is why I titled the post "LT Spice..." >>>> >>>>I can read the C-V curve off the data sheet. What I want to do is make sure (or >>>>force) my Spice sim to behave like the actual diode, so I want to do a >>>>simulation of the diode c-v curve, to make sure I have everything right. >>> >>>I don't know how to post-process data in LTspice, but here's how I do >>>it in PSpice... >>> >>><http://www.analog-innovations.com/SED/C-V_Plot%20-%20PSpice%20AD.png> >>> >>>An alternative is to do it like the Keithley does, superimpose a small >>>sinusoidal signal on the DC, and measure the co-sinusoidal current. >>> >>> ...Jim Thompson >> >>The voltage ramp thing that I did seems OK. >> >>It does report the initial capacitance of a 1N914 as 4 pF, which is high, but >>that's the value in the LT Spice model. > >The PSpice model has the same CJ0. > > ...Jim ThompsonVarious data sheets have typs from 4 to 0.85. Not the thing you'd want to use as a varicap. I do need a "power varicap" for a weird thing I'm considering. I figured I'd fudge up some standard LT library parts, series and parallel or whatever, to see if my circuit might work. If it does, then I can try to find real diodes with the required CV curves. -- John Larkin Highland Technology Inc www.highlandtechnology.com jlarkin at highlandtechnology dot com Precision electronic instrumentation