Suppose I have a circuit with 20 nodes, N1 ... N20.

I want to plot the node voltages, left to right on the screen.

Any ideas?

Clumsy ways:

Build an analog mux and clock it with a counter, plot with time as
x-axis

Push a pulse into a tapped transmission line to sequence a bunch of
switches

Export a file and do it in a separate program
LT Spice challenge
Started by ●August 19, 2021
Reply by ●August 19, 20212021-08-19
On Thursday, August 19, 2021 at 4:08:23 PM UTC-7, John Larkin wrote:> Suppose I have a circuit with 20 nodes, N1 ... N20. > > I want to plot the node voltages, left to right on the screen. > > Any ideas?So, left-to-right is the node number? Not a time axis? And, node voltage is the vertical axis? Are you looking for a slide show, one node per slide?
Reply by ●August 19, 20212021-08-19
On Thu, 19 Aug 2021 16:27:20 -0700 (PDT), whit3rd <whit3rd@gmail.com> wrote:>On Thursday, August 19, 2021 at 4:08:23 PM UTC-7, John Larkin wrote: >> Suppose I have a circuit with 20 nodes, N1 ... N20. >> >> I want to plot the node voltages, left to right on the screen. >> >> Any ideas? > >So, left-to-right is the node number? Not a time axis? >And, node voltage is the vertical axis?It's the node number, but if LT spice wants to plot it as time, I don't mind. 0-20 seconds could be equivalent to node numbers. Vertical would be node voltages.> >Are you looking for a slide show, one node per slide?No, all 20 node voltages plotted on the screen, left to right. Imagine a 20-tap voltage divider with equal resistors, makes a straight line. Unequal Rs could trace out a curve.
Reply by ●August 19, 20212021-08-19
On Thursday, August 19, 2021 at 8:12:05 PM UTC-4, John Larkin wrote:> On Thu, 19 Aug 2021 16:27:20 -0700 (PDT), whit3rd <whi...@gmail.com> > wrote: > >On Thursday, August 19, 2021 at 4:08:23 PM UTC-7, John Larkin wrote: > >> Suppose I have a circuit with 20 nodes, N1 ... N20. > >> > >> I want to plot the node voltages, left to right on the screen. > >> > >> Any ideas? > > > >So, left-to-right is the node number? Not a time axis? > >And, node voltage is the vertical axis? > It's the node number, but if LT spice wants to plot it as time, I > don't mind. 0-20 seconds could be equivalent to node numbers. > > Vertical would be node voltages. > > > >Are you looking for a slide show, one node per slide? > No, all 20 node voltages plotted on the screen, left to right. > > Imagine a 20-tap voltage divider with equal resistors, makes a > straight line. Unequal Rs could trace out a curve.You want a bar graph of 20 different voltages. Don't know how to do that, but it can make 20 graphs in different colors. Of course, I don't think LT spice can even use 20 colors, so not all different. Isn't there a way to write a simple equation based on time that will put that into a single signal? I could do that pretty easily in Excel, but LTspice is pretty grody. Try the LTspice group. They still have some knowledgeable folks there, but you have to be nice to them. -- Rick C. - Get 1,000 miles of free Supercharging - Tesla referral code - https://ts.la/richard11209
Reply by ●August 19, 20212021-08-19
On Thu, 19 Aug 2021 16:08:12 -0700, John Larkin <jlarkin@highland_atwork_technology.com> wrote:>Suppose I have a circuit with 20 nodes, N1 ... N20. > >I want to plot the node voltages, left to right on the screen. > >Any ideas? > >Clumsy ways: > >Build an analog mux and clock it with a counter, plot with time as >x-axis > >Push a pulse into a tapped transmission line to sequence a bunch of >switches > >Export a file and do it in a separate programSounds like a table, rather than a plot. You can always swap an axis to get a vertical plot. RL
Reply by ●August 20, 20212021-08-20
On Thu, 19 Aug 2021 22:39:00 -0400, legg <legg@nospam.magma.ca> wrote:>On Thu, 19 Aug 2021 16:08:12 -0700, John Larkin ><jlarkin@highland_atwork_technology.com> wrote: > >>Suppose I have a circuit with 20 nodes, N1 ... N20. >> >>I want to plot the node voltages, left to right on the screen. >> >>Any ideas? >> >>Clumsy ways: >> >>Build an analog mux and clock it with a counter, plot with time as >>x-axis >> >>Push a pulse into a tapped transmission line to sequence a bunch of >>switches >> >>Export a file and do it in a separate program > >Sounds like a table, rather than a plot.I want a plot. LT Spice now has the ADG1208 analog mux. Three of them lets me scan 24 points. I can drive them from a 1 Hz counter or a few pulse generators.> >You can always swap an axis to get a vertical plot. > >RL-- Father Brown's figure remained quite dark and still; but in that instant he had lost his head. His head was always most valuable when he had lost it.
Reply by ●August 20, 20212021-08-20
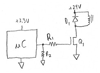
jlarkin@highlandsniptechnology.com wrote:> On Thu, 19 Aug 2021 22:39:00 -0400, legg <legg@nospam.magma.ca> wrote: > >>On Thu, 19 Aug 2021 16:08:12 -0700, John Larkin >><jlarkin@highland_atwork_technology.com> wrote: >> >>>Suppose I have a circuit with 20 nodes, N1 ... N20. >>> >>>I want to plot the node voltages, left to right on the screen. >>> >>>Any ideas? >>> >>>Clumsy ways: >>> >>>Build an analog mux and clock it with a counter, plot with time as >>>x-axis >>> >>>Push a pulse into a tapped transmission line to sequence a bunch of >>>switches >>> >>>Export a file and do it in a separate program >> >>Sounds like a table, rather than a plot. > > I want a plot. > > LT Spice now has the ADG1208 analog mux. Three of them lets me scan 24 > points. I can drive them from a 1 Hz counter or a few pulse > generators.You can also decode the .RAW file and do anything you want with the data. Here's an example of a simple noise plot of a 120 ohm resistor into a 100uF capacitor. Here's the ASC file: Version 4 SHEET 1 2748 1700 WIRE 1456 -352 1440 -352 WIRE 1568 -352 1456 -352 WIRE 1712 -352 1648 -352 WIRE 1776 -352 1712 -352 WIRE 1440 -320 1440 -352 WIRE 1776 -320 1776 -352 WIRE 1776 -240 1776 -256 WIRE 1440 -208 1440 -240 FLAG 1712 -352 Vn FLAG 1440 -208 0 FLAG 1776 -240 0 FLAG 1456 -352 Vin SYMBOL res 1664 -368 R90 WINDOW 0 0 56 VBottom 2 WINDOW 3 32 56 VTop 2 SYMATTR InstName R1 SYMATTR Value 120 SYMBOL voltage 1440 -336 R0 WINDOW 123 35 61 Left 2 WINDOW 39 0 0 Left 2 SYMATTR Value2 AC 1 SYMATTR InstName V1 SYMATTR Value 0 SYMBOL cap 1760 -320 R0 SYMATTR InstName C1 SYMATTR Value 100uf TEXT 1408 -488 Left 2 ;'Noise Calculations TEXT 1408 -464 Left 2 !.noise v(Vn) V1 dec 100 1 1e6 Here's the ASCII header of the RAW file. The data starts after the Binary tag. Just read the numbers as directed in the header and give them to a plot program of your choice. Title: * C:\SWCADIII\DAT\TL431\524A0417.ASC Date: Fri Aug 20 05:27:56 2021 Plotname: Noise Spectral Density - (V/Hz� or A/Hz�) Output: vn Flags: real forward log No. Variables: 5 No. Points: 601 Offset: 0.0000000000000000e+000 Command: Linear Technology Corporation LTspice IV Variables: 0 frequency frequency 1 gain gain 2 V(r1) voltage 3 V(onoise) voltage 4 V(inoise) voltage Binary: I use WPlot32 by W.G. Hood from 1994. It does 2 and 3-dimensional plots with linear or log axis. Data can be fit by a smooth curve or least squares polynomial or exponential. The FFT and functions can be plotted. WPlot can be controlled from a GUI or command line. It works on XP and probably will work on Win7 if you use the TAME program for DOS. There are plenty of plot programs. WPlot32 can be found at https://www.xray.cz/ecm-cd/soft/win/index0065.html -- The best designs occur in the theta state. - sw
Reply by ●August 20, 20212021-08-20
On 20/08/2021 00:08, John Larkin wrote:> Suppose I have a circuit with 20 nodes, N1 ... N20. > > I want to plot the node voltages, left to right on the screen. > > Any ideas? > > Clumsy ways: > > Build an analog mux and clock it with a counter, plot with time as > x-axis > > Push a pulse into a tapped transmission line to sequence a bunch of > switches > > Export a file and do it in a separate program >Shift register from D flops plus analog switches. -- Cheers Clive
Reply by ●August 20, 20212021-08-20
On Fri, 20 Aug 2021 09:57:26 -0000 (UTC), Steve Wilson <spamme@not.com> wrote:>jlarkin@highlandsniptechnology.com wrote: > >> On Thu, 19 Aug 2021 22:39:00 -0400, legg <legg@nospam.magma.ca> wrote: >> >>>On Thu, 19 Aug 2021 16:08:12 -0700, John Larkin >>><jlarkin@highland_atwork_technology.com> wrote: >>> >>>>Suppose I have a circuit with 20 nodes, N1 ... N20. >>>> >>>>I want to plot the node voltages, left to right on the screen. >>>> >>>>Any ideas? >>>> >>>>Clumsy ways: >>>> >>>>Build an analog mux and clock it with a counter, plot with time as >>>>x-axis >>>> >>>>Push a pulse into a tapped transmission line to sequence a bunch of >>>>switches >>>> >>>>Export a file and do it in a separate program >>> >>>Sounds like a table, rather than a plot. >> >> I want a plot. >> >> LT Spice now has the ADG1208 analog mux. Three of them lets me scan 24 >> points. I can drive them from a 1 Hz counter or a few pulse >> generators. > >You can also decode the .RAW file and do anything you want with the data.Sure, but that's a chore and isn't very interactive. People (and mice) learn from rapid feedback. -- Father Brown's figure remained quite dark and still; but in that instant he had lost his head. His head was always most valuable when he had lost it.
Reply by ●August 20, 20212021-08-20
On Fri, 20 Aug 2021 11:41:30 +0100, Clive Arthur <clive@nowaytoday.co.uk> wrote:>On 20/08/2021 00:08, John Larkin wrote: >> Suppose I have a circuit with 20 nodes, N1 ... N20. >> >> I want to plot the node voltages, left to right on the screen. >> >> Any ideas? >> >> Clumsy ways: >> >> Build an analog mux and clock it with a counter, plot with time as >> x-axis >> >> Push a pulse into a tapped transmission line to sequence a bunch of >> switches >> >> Export a file and do it in a separate program >> > >Shift register from D flops plus analog switches.Yes, but a few analog mux's and a counter is less busy. I just noticed that LT Spice now includes the ADI analog mux chips. Six pulse generator voltage sources would generate the addresses and enables for three 8:1 mux chips. I guess one could use the LT counter element as a ripple counter too... 4 of those. -- Father Brown's figure remained quite dark and still; but in that instant he had lost his head. His head was always most valuable when he had lost it.