On Mon, 28 Jul 2014 07:58:07 -0700, Phil Hobbs <hobbs@electrooptical.net> wrote:>> ..snip...everything? oopskudos, you got pretty close with those two, BUT the max time run was 8mS ?! and the PDF is skewed to negative value, like 0.12 in +/- 1 range. see notes attached: Version 4 SHEET 1 1656 900 WIRE -480 208 -512 208 WIRE -480 224 -480 208 WIRE -1040 240 -1056 240 WIRE -800 240 -816 240 WIRE -1056 288 -1056 240 WIRE -816 288 -816 240 WIRE 128 288 0 288 WIRE 144 288 128 288 WIRE 0 320 0 288 WIRE -480 336 -480 304 WIRE -160 336 -176 336 WIRE -48 336 -160 336 WIRE -160 384 -176 384 WIRE -48 384 -160 384 WIRE -1056 400 -1056 368 WIRE -816 400 -816 368 WIRE -496 416 -512 416 WIRE -496 432 -496 416 WIRE 0 432 0 400 WIRE -496 528 -496 512 FLAG -1056 400 0 FLAG -1040 240 n1 FLAG -816 400 0 FLAG -800 240 n2 FLAG -496 528 0 FLAG -480 336 0 FLAG -512 416 gn1 FLAG -512 208 gn2 FLAG 0 432 0 FLAG -160 336 gn2 FLAG -160 384 gn1 FLAG 128 288 out SYMBOL bv -1056 272 R0 SYMATTR InstName B2 SYMATTR Value V=rand(50000*time) SYMBOL bv -816 272 R0 SYMATTR InstName B1 SYMATTR Value V=rand(50000*time-20000) SYMBOL bv -496 416 R0 SYMATTR InstName B3 SYMATTR Value V=sqrt(-2*ln(v(n2)))*cos(2*pi*v(n1)) SYMBOL bv -480 208 R0 WINDOW 3 60 49 Left 2 SYMATTR Value V=sqrt(-2*ln(v(n2)))*sin(2*pi*v(n1)) SYMATTR InstName B4 SYMBOL e 0 304 R0 SYMATTR InstName E1 SYMATTR Value {1/sqrt(2)} TEXT -1048 456 Left 2 !.tran 8m TEXT -1256 496 Left 2 ;ARRRGGG! can't run for more than 8mS, else nulls out!!\ngn1,2's PDF appears to 'peak' somewhere near -0.12 in the range of +/- 1\nout PDF appears to 'peak' somewhere near +0.09 in the range of +/- 1
Learning about oscillators in LTSpice
Started by ●October 21, 2010
Reply by ●July 28, 20142014-07-28
Reply by ●July 28, 20142014-07-28
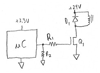
On Sat, 26 Jul 2014 14:34:46 -0700, John Larkin <jjlarkin@highnotlandthistechnologypart.com> wrote:>> ..snip... > > Post an LT Spice demo. >whew Since limited by length here, will try to put everything in. Basically start with a set of PWL files for LTspice to use: description of Vn1.txt PWL file with 0 0 at the start. after that the time is actually the count, and each value is a gaussian random value with an rms value of 1. The STEP is required to thwart LTspice from the likelihood of linearly interpolating between two diverse points, thus destroying high frequency energy in the PWL noise file. Note, to test any schematic before full implementation, simply use 'dummy' files containing nothing but two terms, 0 0. An example of a typical Vn1.txt PWL file is to do this for 220001 steps: 0.0 0 0.1 -0.131558 1.0 -0.131558 1.1 0.867919 2.0 0.867919 2.1 -1.33285 3.0 -1.33285 3.1 1.50479 4.0 1.50479 4.1 0.266214 5.0 0.266214 . . . 109999.0 -0.0523589 109999.1 -0.622929 110000.0 -0.622929 Each file is then scaled both in VALUE and in TIME to be used in the schematic. Then make a bunch of non-coherent files and use the PROPERLY. Herre is an octave [runs on 2.1.50a] funcion that creates a single file: function [N]=noisefile(filename,N); % this function creates a text file compatible with LTspice PWL noise input % optional input N defualts to 100000 steps to make the file 110001 entries. % use the form [N]=noisefile(filename,[N]); where the filename is a text variable % and optional N defaults to 100000 % Note N is returned as a courtesy and .txt is added to the name of the file if ((nargin==0) || (nargin>2)) help noisefile; return; endif if (nargin==1) N=100000; endif if ( sum(isalpha(filename)) <1 ) disp("ERROR - filename MUST be text"); return; endif filename=[filename,".txt"]; % Linear steps, not useable, because LTspice linearly interpolates between each % time value, thus destroying high frequency content %n=round(1.1*N+1); %v=randn(n,1); %f=fopen(filename,"w"); %for i=1:n %fprintf(f,"%d\t%g\n",i-1,v(i)); %endfor %fclose(f); % In order to preserve the high frequency content of the noise, need to HOLD value % until just before the value changes at the next sample point. % whether the variable are 1,N or N,1 makes NO difference because thevariables are % written into the file one at a time. n=1.1*N; t=[0,zeros(1,2*n)]; t(3:2:2*n+1)=[1:n]; t(2:2:2*n)=t(3:2:2*n+1)-9/10; v=[0,zeros(1,2*n)]; v(3:2:2*n+1)=randn(1,n); v(2:2:2*n)=v(3:2:2*n+1); f=fopen(filename,"w"); for i=1:2*n+1 fprintf(f,"%6.1f\t%g\n",t(i),v(i)); endfor fclose(f); endfunction; Here is a script that will run, creating 10 sets of files % This program creates nine noise files named Vn1.txt thrugh Vn9.txt % Each file contains 110001 values. for ii=1:2 ii filename=["Vn",int2str(ii)]; noisefile(filename); endfor After running these you're almost set to go. You have to judiciously apply the files: Here is a SINGLE noise source: Version 4 SHEET 1 27404 860 WIRE 2064 -432 2048 -432 WIRE 2160 -432 2144 -432 WIRE 2048 -336 2048 -432 WIRE 2048 -336 1936 -336 WIRE 2064 -336 2048 -336 WIRE 2160 -336 2160 -432 WIRE 2160 -336 2144 -336 WIRE 2256 -336 2160 -336 WIRE 2368 -336 2256 -336 WIRE 2400 -336 2368 -336 WIRE 1936 -304 1936 -336 WIRE 2256 -304 2256 -336 WIRE 2256 -208 2256 -240 WIRE 1936 -192 1936 -224 FLAG 2256 -208 0 FLAG 1936 -192 0 FLAG 2368 -336 out SYMBOL res 2160 -352 R90 WINDOW 0 0 56 VBottom 2 WINDOW 3 32 56 VTop 2 SYMATTR InstName R1 SYMATTR Value {R} SYMBOL cap 2240 -304 R0 SYMATTR InstName C1 SYMATTR Value {C} SYMBOL voltage 1936 -320 R0 WINDOW 0 48 35 Left 2 WINDOW 3 33 98 Left 2 WINDOW 123 50 63 Left 2 WINDOW 39 0 0 Left 2 SYMATTR InstName V1 SYMATTR Value SINE(0 {sqrt(2)*20u} 10) SYMATTR Value2 AC 1 SYMBOL current 2144 -432 R90 WINDOW 0 -89 36 VBottom 2 WINDOW 3 -90 3 VTop 2 SYMATTR InstName InoiseR1 SYMATTR Value PWL value_scale_factor={sqrt(4*k*T/R/dt)} time_scale_factor={dt} file=Vn1.txt TEXT 2992 -176 Left 2 ;right edge TEXT 2504 -288 Left 2 !.tran 0 {Tstop} 0 {dt/2} TEXT 1632 -416 Left 2 !.options plotwinsize=0;\n.param k=1.38e-23 T=300\n.param fmax=100\n.param dt={1/2/fmax}\n.param Tstop=5\n.param BW={1/Tstop}\n.param R=1MEG C=1nF TEXT 1664 -480 Left 2 ;Note to prevent 'clutter' on the schematic the "PWL..." statement is usually NOT shown. TEXT 2504 -352 Left 2 ;.ac dec 200 {BW} {fmax} TEXT 2504 -320 Left 2 ;.noise V(out) V1 dec 200 {BW} {fmax} TEXT 1632 -208 Left 2 ;.param N={Tstop*2*fmax} TEXT 2280 -560 Left 4 ;EXAMPLE .tranoise and here are TWO noise sources WITH comparisons to see how the two are completely non-coherent. Version 4 SHEET 1 2172 680 WIRE -176 -256 -240 -256 WIRE -64 -256 -176 -256 WIRE -48 -256 -64 -256 WIRE -240 -224 -240 -256 WIRE -240 -112 -240 -144 WIRE 176 -80 64 -80 WIRE 192 -80 176 -80 WIRE 64 -64 64 -80 WIRE -176 -48 -176 -256 WIRE 16 -48 -176 -48 WIRE 16 0 -176 0 WIRE 64 64 64 16 WIRE -176 128 -176 0 WIRE -176 128 -240 128 WIRE -64 128 -176 128 WIRE -48 128 -64 128 WIRE -240 160 -240 128 WIRE -240 272 -240 240 FLAG -240 272 0 FLAG -240 -112 0 FLAG 64 64 0 FLAG -64 -256 N2 FLAG -64 128 N1 FLAG 176 -80 out SYMBOL e 64 -80 R0 SYMATTR InstName E1 SYMATTR Value {1/sqrt(2)} SYMBOL voltage -240 144 R0 WINDOW 123 0 0 Left 2 WINDOW 39 0 0 Left 2 SYMATTR InstName V1 SYMATTR Value PWL value_scale_factor={Vrms/sqrt(dt)} time_scale_factor={dt} file=Vn1.txt SYMBOL voltage -240 -240 R0 WINDOW 123 0 0 Left 2 WINDOW 39 0 0 Left 2 SYMATTR InstName V2 SYMATTR Value PWL value_scale_factor={Vrms/sqrt(dt)} time_scale_factor={dt} file=Vn2.txt TEXT 88 -304 Left 2 !.tran 0 {Tstop} 0 {dt/2} TEXT 72 -408 Left 3 ;PWL Noise Sources TEXT 96 -264 Left 2 !.param fmax=12.5kHz Tstop=2\n.param Vrms=1 BW={1/Tstop} dt={1/2/fmax} TEXT -264 -360 Left 2 ;almost set to approx match Phil Hobbs' approach, at least match useable spectral flatness range of 12.5kHz TEXT 840 -192 Left 2 ;If PWL value_scale_factor={Vrms} time_scale_factor={dt} file=Vn2.txt\nN1 = 981.74mVrms\nN2 = 984.04mVrms\nOUT = 979.08mVrms\nslightly lower than 1Vrms because LTspice linearly interpolates between sample points\nPlotting spectrum from 0.5Hz to 12.5kHz yields each spectrum overlayed at approx -48dB TEXT 832 8 Left 2 ;If use the FULL calibration, PWL value_scale_factor={Vrms/sqrt(dt)} time_scale_factor={dt} file=Vn2.txt\nPlot N1, N2, and V(out) spectral from 0.5Hz [minimum] to 12.5kHz the spectrums of ALL\nthree lie on top each other at approx -3dB, which of course, calculates out to 1Vrms/rtHz\n \nNote the slight rounding that starts near 8kHz is an artifact of LTspice FFT, EXPORTING\n the variables and THEN performing straight processing there is NO roundoff. And, the\n noise energy calculates to within 0.5% of 'proper' noise density value in terms of Vrms/sqrtHz.
Reply by ●July 28, 20142014-07-28
On 7/28/2014 6:44 PM, RobertMacy wrote:> On Mon, 28 Jul 2014 07:58:07 -0700, Phil Hobbs > <hobbs@electrooptical.net> wrote: > >>> ..snip...everything? oops > > kudos, you got pretty close with those two, BUT the max time run was 8mS > ?! and the PDF is skewed to negative value, like 0.12 in +/- 1 range. > > see notes attached: > > > Version 4 > SHEET 1 1656 900 > WIRE -480 208 -512 208 > WIRE -480 224 -480 208 > WIRE -1040 240 -1056 240 > WIRE -800 240 -816 240 > WIRE -1056 288 -1056 240 > WIRE -816 288 -816 240 > WIRE 128 288 0 288 > WIRE 144 288 128 288 > WIRE 0 320 0 288 > WIRE -480 336 -480 304 > WIRE -160 336 -176 336 > WIRE -48 336 -160 336 > WIRE -160 384 -176 384 > WIRE -48 384 -160 384 > WIRE -1056 400 -1056 368 > WIRE -816 400 -816 368 > WIRE -496 416 -512 416 > WIRE -496 432 -496 416 > WIRE 0 432 0 400 > WIRE -496 528 -496 512 > FLAG -1056 400 0 > FLAG -1040 240 n1 > FLAG -816 400 0 > FLAG -800 240 n2 > FLAG -496 528 0 > FLAG -480 336 0 > FLAG -512 416 gn1 > FLAG -512 208 gn2 > FLAG 0 432 0 > FLAG -160 336 gn2 > FLAG -160 384 gn1 > FLAG 128 288 out > SYMBOL bv -1056 272 R0 > SYMATTR InstName B2 > SYMATTR Value V=rand(50000*time) > SYMBOL bv -816 272 R0 > SYMATTR InstName B1 > SYMATTR Value V=rand(50000*time-20000) > SYMBOL bv -496 416 R0 > SYMATTR InstName B3 > SYMATTR Value V=sqrt(-2*ln(v(n2)))*cos(2*pi*v(n1)) > SYMBOL bv -480 208 R0 > WINDOW 3 60 49 Left 2 > SYMATTR Value V=sqrt(-2*ln(v(n2)))*sin(2*pi*v(n1)) > SYMATTR InstName B4 > SYMBOL e 0 304 R0 > SYMATTR InstName E1 > SYMATTR Value {1/sqrt(2)} > TEXT -1048 456 Left 2 !.tran 8m > TEXT -1256 496 Left 2 ;ARRRGGG! can't run for more than 8mS, else nulls > out!!\ngn1,2's PDF appears to 'peak' somewhere near -0.12 in the range > of +/- 1\nout PDF appears to 'peak' somewhere near +0.09 in the range of > +/- 1I discussed how to fix that in later posts, like so. I asked on the Yahoo LTspice group whether there's any way to do frequency binning on the LTspice FFT function. So far, it doesn't look like it. Cheers Phil Hobbs Version 4 SHEET 1 1656 900 WIRE -224 192 -256 192 WIRE -224 208 -224 192 WIRE -96 288 -112 288 WIRE 208 288 192 288 WIRE -224 320 -224 288 WIRE -112 336 -112 288 WIRE 192 336 192 288 WIRE -240 400 -256 400 WIRE -240 416 -240 400 WIRE -112 448 -112 416 WIRE 192 448 192 416 WIRE -240 512 -240 496 FLAG -112 448 0 FLAG -96 288 n1 FLAG 192 448 0 FLAG 208 288 n2 FLAG -240 512 0 FLAG -224 320 0 FLAG -256 400 gn1 FLAG -256 192 gn2 SYMBOL bv -112 320 R0 SYMATTR InstName B2 SYMATTR Value V=rand(-50000*time) SYMBOL bv 192 320 R0 SYMATTR InstName B1 SYMATTR Value V=rand(50000*time-20000) SYMBOL bv -240 400 R0 SYMATTR InstName B3 SYMATTR Value V=sqrt(-2*ln(v(n2)))*cos(2*pi*v(n1)) SYMBOL bv -224 192 R0 WINDOW 3 60 49 Left 2 SYMATTR Value V=sqrt(-2*ln(v(n2)))*sin(2*pi*v(n1)) SYMATTR InstName B4 TEXT -32 352 Left 2 !.tran 2.097152 TEXT 192 504 Left 2 !.options plotwinsize=0 maxstep=1u -- Dr Philip C D Hobbs Principal Consultant ElectroOptical Innovations LLC Optics, Electro-optics, Photonics, Analog Electronics 160 North State Road #203 Briarcliff Manor NY 10510 hobbs at electrooptical dot net http://electrooptical.net
Reply by ●July 28, 20142014-07-28
On Mon, 28 Jul 2014 16:15:18 -0700, Phil Hobbs <hobbs@electrooptical.net> wrote:>>> ...snip.... > > I discussed how to fix that in later posts, like so. I asked on the > Yahoo LTspice group whether there's any way to do frequency binning on > the LTspice FFT function. So far, it doesn't look like it. > > Cheers > > Phil Hobbs >I saw that, ....but didn't understand the purpose of the discussion and deleted the thread. didn't know you started it, thought John Woodgate, UK started it. oops. Check a reply to John Larking, the FULL details of how to do the .transoise technique are in there. From experience, watch out for LTspice's many, many 'adjustments' that skew results much more than expected. Sometimes I just give up and EXPORT to control the processing done to the signal. The biggest is the way the FFT starts rounding down BEFORE it should, and the other is the way it SPREADS energy when you think it shouldn't. Don't get me wrong, Mike's a GENIUS when it comes to how to handle the unknown signals, waveforms conditions, etc. sheer genius. Notice how the technique doesn't require much thought process, so you can concentrate on the design, not the tool. plus, doesn't add many nodes.
Reply by ●July 28, 20142014-07-28
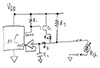
On Mon, 28 Jul 2014 16:31:38 -0700, RobertMacy <robert.a.macy@gmail.com> wrote:>On Mon, 28 Jul 2014 16:15:18 -0700, Phil Hobbs <hobbs@electrooptical.net> >wrote: > >>>> ...snip.... >> >> I discussed how to fix that in later posts, like so. I asked on the >> Yahoo LTspice group whether there's any way to do frequency binning on >> the LTspice FFT function. So far, it doesn't look like it. >> >> Cheers >> >> Phil Hobbs >> >I saw that, ....but didn't understand the purpose of the discussion and >deleted the thread. didn't know you started it, thought John Woodgate, UK >started it. oops. > >Check a reply to John Larking, the FULL details of how to do the >.transoise technique are in there.Seems awfully complex. This is pretty good: Version 4 SHEET 1 880 680 WIRE 192 64 128 64 WIRE 272 64 192 64 WIRE 432 64 352 64 WIRE 512 64 432 64 WIRE 576 64 512 64 WIRE 128 96 128 64 WIRE 432 112 432 64 WIRE 128 208 128 176 WIRE 432 208 432 176 FLAG 128 208 0 FLAG 192 64 NOISE FLAG 432 208 0 FLAG 512 64 LPF SYMBOL bv 128 80 R0 WINDOW 0 -68 104 Left 2 WINDOW 3 -225 179 Left 2 SYMATTR InstName B1 SYMATTR Value V=58.65 * ( rand(12345*time) - 0.5 ) SYMBOL res 368 48 R90 WINDOW 0 72 56 VBottom 2 WINDOW 3 78 56 VTop 2 SYMATTR InstName R1 SYMATTR Value 1 SYMBOL cap 416 112 R0 WINDOW 0 70 20 Left 2 WINDOW 3 63 53 Left 2 SYMATTR InstName C1 SYMATTR Value 0.016 TEXT -176 104 Left 2 !.tran 0 10 0 10u TEXT 24 -40 Left 2 ;10 Hz Noise Source J Larkin July 28, 2014 rand() runs about 6 times faster than random() and gives slightly better crest factors and a mildly messier spectrum. Shaping the noise spectrum would be easy by futzing the filter. -- John Larkin Highland Technology, Inc jlarkin att highlandtechnology dott com http://www.highlandtechnology.com
Reply by ●July 28, 20142014-07-28
On 7/28/2014 6:44 PM, RobertMacy wrote:> On Mon, 28 Jul 2014 07:58:07 -0700, Phil Hobbs > <hobbs@electrooptical.net> wrote: > >>> ..snip...everything? oops > > kudos, you got pretty close with those two, BUT the max time run was 8mS > ?! and the PDF is skewed to negative value, like 0.12 in +/- 1 range. > > see notes attached: >The weird artifacts come from excess Mike cleverness, and from not setting a maximum time step. Try this, switch to straight trapezoidal and the "alternate" solver, and use a 2097152-point FFT. Good behaviour results. Cheers Phil Hobbs Version 4 SHEET 1 1656 900 WIRE -480 208 -512 208 WIRE -480 224 -480 208 WIRE -1040 240 -1056 240 WIRE -800 240 -816 240 WIRE -1056 288 -1056 240 WIRE -816 288 -816 240 WIRE 128 288 0 288 WIRE 144 288 128 288 WIRE 0 320 0 288 WIRE -480 336 -480 304 WIRE -160 336 -176 336 WIRE -48 336 -160 336 WIRE -160 384 -176 384 WIRE -48 384 -160 384 WIRE -1056 400 -1056 368 WIRE -816 400 -816 368 WIRE -496 416 -512 416 WIRE -496 432 -496 416 WIRE 0 432 0 400 WIRE -496 528 -496 512 FLAG -1056 400 0 FLAG -1040 240 n1 FLAG -816 400 0 FLAG -800 240 n2 FLAG -496 528 0 FLAG -480 336 0 FLAG -512 416 gn1 FLAG -512 208 gn2 FLAG 0 432 0 FLAG -160 336 gn2 FLAG -160 384 gn1 FLAG 128 288 out SYMBOL bv -1056 272 R0 SYMATTR InstName B2 SYMATTR Value V=random(50000*time) SYMBOL bv -816 272 R0 SYMATTR InstName B1 SYMATTR Value V=rand(101000*time+21000) SYMBOL bv -496 416 R0 SYMATTR InstName B3 SYMATTR Value V=sqrt(-2*ln(v(n2)))*cos(2*pi*v(n1)) SYMBOL bv -480 208 R0 WINDOW 3 60 49 Left 2 SYMATTR Value V=sqrt(-2*ln(v(n2)))*sin(2*pi*v(n1)) SYMATTR InstName B4 SYMBOL e 0 304 R0 SYMATTR InstName E1 SYMATTR Value {1/sqrt(2)} TEXT -1048 456 Left 2 !.tran 0 2.097152 0 1u TEXT -1256 496 Left 2 ;ARRRGGG! can't run for more than 8mS, else nulls out!!\ngn1,2's PDF appears to 'peak' somewhere near -0.12 in the range of � 1\nout PDF appears to 'peak' somewhere near +0.09 in the range of � 1 TEXT -408 448 Left 2 !.options plotwinsize=0 Version 4 SHEET 1 1656 900 WIRE -480 208 -512 208 WIRE -480 224 -480 208 WIRE -1040 240 -1056 240 WIRE -800 240 -816 240 WIRE -1056 288 -1056 240 WIRE -816 288 -816 240 WIRE 128 288 0 288 WIRE 144 288 128 288 WIRE 0 320 0 288 WIRE -480 336 -480 304 WIRE -160 336 -176 336 WIRE -48 336 -160 336 WIRE -160 384 -176 384 WIRE -48 384 -160 384 WIRE -1056 400 -1056 368 WIRE -816 400 -816 368 WIRE -496 416 -512 416 WIRE -496 432 -496 416 WIRE 0 432 0 400 WIRE -496 528 -496 512 FLAG -1056 400 0 FLAG -1040 240 n1 FLAG -816 400 0 FLAG -800 240 n2 FLAG -496 528 0 FLAG -480 336 0 FLAG -512 416 gn1 FLAG -512 208 gn2 FLAG 0 432 0 FLAG -160 336 gn2 FLAG -160 384 gn1 FLAG 128 288 out SYMBOL bv -1056 272 R0 SYMATTR InstName B2 SYMATTR Value V=random(50000*time) SYMBOL bv -816 272 R0 SYMATTR InstName B1 SYMATTR Value V=rand(101000*time+21000) SYMBOL bv -496 416 R0 SYMATTR InstName B3 SYMATTR Value V=sqrt(-2*ln(v(n2)))*cos(2*pi*v(n1)) SYMBOL bv -480 208 R0 WINDOW 3 60 49 Left 2 SYMATTR Value V=sqrt(-2*ln(v(n2)))*sin(2*pi*v(n1)) SYMATTR InstName B4 SYMBOL e 0 304 R0 SYMATTR InstName E1 SYMATTR Value {1/sqrt(2)} TEXT -1048 456 Left 2 !.tran 0 2.097152 0 1u TEXT -1256 496 Left 2 ;ARRRGGG! can't run for more than 8mS, else nulls out!!\ngn1,2's PDF appears to 'peak' somewhere near -0.12 in the range of � 1\nout PDF appears to 'peak' somewhere near +0.09 in the range of � 1 TEXT -408 448 Left 2 !.options plotwinsize=0 -- Dr Philip C D Hobbs Principal Consultant ElectroOptical Innovations LLC Optics, Electro-optics, Photonics, Analog Electronics 160 North State Road #203 Briarcliff Manor NY 10510 hobbs at electrooptical dot net http://electrooptical.net
Reply by ●July 28, 20142014-07-28
On 7/28/2014 9:24 PM, John Larkin wrote:> On Mon, 28 Jul 2014 16:31:38 -0700, RobertMacy > <robert.a.macy@gmail.com> wrote: > >> On Mon, 28 Jul 2014 16:15:18 -0700, Phil Hobbs <hobbs@electrooptical.net> >> wrote: >> >>>>> ...snip.... >>> >>> I discussed how to fix that in later posts, like so. I asked on the >>> Yahoo LTspice group whether there's any way to do frequency binning on >>> the LTspice FFT function. So far, it doesn't look like it. >>> >>> Cheers >>> >>> Phil Hobbs >>> >> I saw that, ....but didn't understand the purpose of the discussion and >> deleted the thread. didn't know you started it, thought John Woodgate, UK >> started it. oops. >> >> Check a reply to John Larking, the FULL details of how to do the >> .transoise technique are in there. > > Seems awfully complex. This is pretty good: > > > Version 4 > SHEET 1 880 680 > WIRE 192 64 128 64 > WIRE 272 64 192 64 > WIRE 432 64 352 64 > WIRE 512 64 432 64 > WIRE 576 64 512 64 > WIRE 128 96 128 64 > WIRE 432 112 432 64 > WIRE 128 208 128 176 > WIRE 432 208 432 176 > FLAG 128 208 0 > FLAG 192 64 NOISE > FLAG 432 208 0 > FLAG 512 64 LPF > SYMBOL bv 128 80 R0 > WINDOW 0 -68 104 Left 2 > WINDOW 3 -225 179 Left 2 > SYMATTR InstName B1 > SYMATTR Value V=58.65 * ( rand(12345*time) - 0.5 ) > SYMBOL res 368 48 R90 > WINDOW 0 72 56 VBottom 2 > WINDOW 3 78 56 VTop 2 > SYMATTR InstName R1 > SYMATTR Value 1 > SYMBOL cap 416 112 R0 > WINDOW 0 70 20 Left 2 > WINDOW 3 63 53 Left 2 > SYMATTR InstName C1 > SYMATTR Value 0.016 > TEXT -176 104 Left 2 !.tran 0 10 0 10u > TEXT 24 -40 Left 2 ;10 Hz Noise Source J Larkin July 28, 2014 > > > rand() runs about 6 times faster than random() and gives slightly > better crest factors and a mildly messier spectrum. Shaping the noise > spectrum would be easy by futzing the filter. > >That method is appealingly simple, I agree. It generates independent samples much more slowly than the Box-Mueller approach, though, because you're relying on the central limit theorem to give you your Gaussian statistics, rather than applying the inverse function. Cheers Phil Hobbs -- Dr Philip C D Hobbs Principal Consultant ElectroOptical Innovations LLC Optics, Electro-optics, Photonics, Analog Electronics 160 North State Road #203 Briarcliff Manor NY 10510 hobbs at electrooptical dot net http://electrooptical.net
Reply by ●July 28, 20142014-07-28
On Mon, 28 Jul 2014 18:24:07 -0700, John Larkin <jlarkin@highlandtechnology.com> wrote:>> ...snip... > Seems awfully complex. This is pretty good:May be good, but don't see how to use it to analyze an MC1496, would you show us?
Reply by ●July 29, 20142014-07-29
On Mon, 28 Jul 2014 15:41:08 -0700, RobertMacy <robert.a.macy@gmail.com> wrote:>On Sun, 27 Jul 2014 20:20:10 -0700, John Larkin ><jjlarkin@highnotlandthistechnologypart.com> wrote: > >>> ....snip... >>> "...ain't hard"? Then where are your two calibrated noise sources? >> >> N1. N2. >> > >no, those two are not very incoherent > >V(N1) and V(N2) both have 1 Vrms, but > >V(N2,N1), which has a 1 Vrms also, has a different spectral content by >over 8dB. >The RMS of the sum of N1+N2, over an adequately long observation, is almost exactly 1.41 times the values of N1 and N2. I deliberately made the K values 100 and 101 to demonstrate correlation in the first second of a run. Don't do that in production. This is noise; of course the measurements tend to be noisy. The rand(K*time) function still has a uniform PDF, so it needs work to make it more gaussian: summing, lowpass filtering, hashing. rand() is better than random(), for the better runtime. -- John Larkin Highland Technology Inc www.highlandtechnology.com jlarkin at highlandtechnology dot com Precision electronic instrumentation
Reply by ●July 29, 20142014-07-29
On 7/28/2014 7:02 PM, RobertMacy wrote:> On Sat, 26 Jul 2014 14:34:46 -0700, John Larkin > <jjlarkin@highnotlandthistechnologypart.com> wrote: > >>> ..snip... >> >> Post an LT Spice demo. >> > > whew > > Since limited by length here, will try to put everything in. >Eternal September costs the same as aioe, and doesn't have the silly limitation. Cheers Phil Hobbs -- Dr Philip C D Hobbs Principal Consultant ElectroOptical Innovations LLC Optics, Electro-optics, Photonics, Analog Electronics 160 North State Road #203 Briarcliff Manor NY 10510 hobbs at electrooptical dot net http://electrooptical.net